Students will be give the blank handout "How the Raven Made the Tides" and fill it it according to table on the powerpoint.
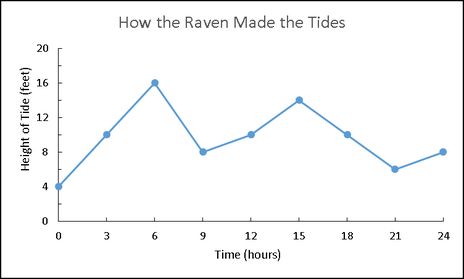
On the left is an exemplar of the finished product.
Question A:
I feel that Raven would have a good meal time at _______ (two answers that fall in ranges below...~below 10 ):
On the left is an exemplar of the finished product.
Question A:
- A villager spent a whole day collecting tidal data, which is organized in the table below. Plot the data from the table on the graph you’ve been provided (hours=x, feet=y)
- Connect the points on the graph
- Write a report to Raven which includes the following:
- Two times of day you feel it would make a good meal time
- An explanation of why you chose these times
- Anything else you want to tell Raven
I feel that Raven would have a good meal time at _______ (two answers that fall in ranges below...~below 10 ):
- Midnight and ~3:00am (00:00 and 03:00)
- 9:00am and Noon (09:00 and 12:00)
- 8:00pm and Midnight (19:00 and 24:00)
|
|
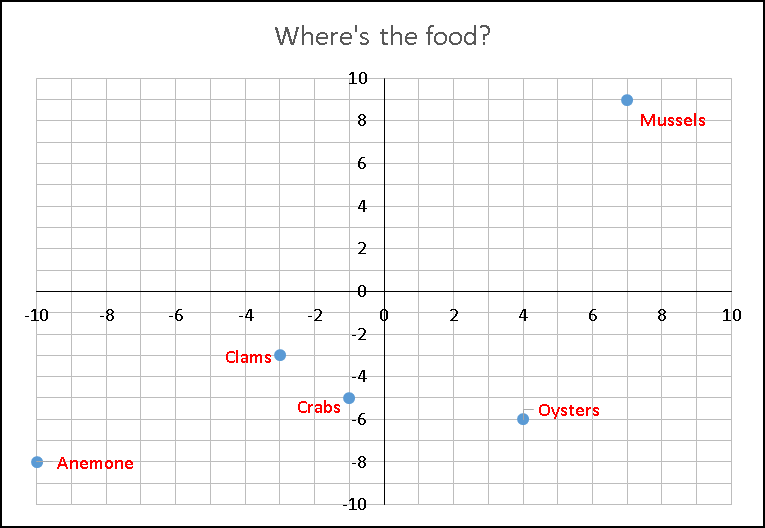
Students will be give the blank handout "Where's the food" (left) and fill it it according to table on the powerpoint.An exemplar of the answer key is below on the right, which satisfies the following question:
Question B:
Question B:
- On the Cartesian grid provided, the following ordered pairs on the graph you created, based on the following data collected by the villager
|
|
